Why has your organic traffic dropped? - A step by step checklist
The feared traffic drop.
"Hey Dom, why has our website traffic dropped?"
Goodbye good times and hello to immediate stress. You've landed on this post in a time of need (or possibly because you're researching job interview questions), so let's cut the pre-amble and jump into it.
A checklist for diagnosing website traffic drops
When you have a traffic drop, you're often under pressure to provide an at least an answer (and often a solution) to what happened quickly.
Because of that this checklist is prioritized by a combination of:
- The likely hood each step is the reason for the traffic drop
- The time it takes to complete each step
1. Check the sampling on the analytics you are looking at
Immediate sanity check. Is our data sampled?
Analytics platforms have a tendency to sample data and sometimes this can lead to it be wildly un-representative (like creating a traffic drop). Let's make sure we're not seeing an artifact of sampling.
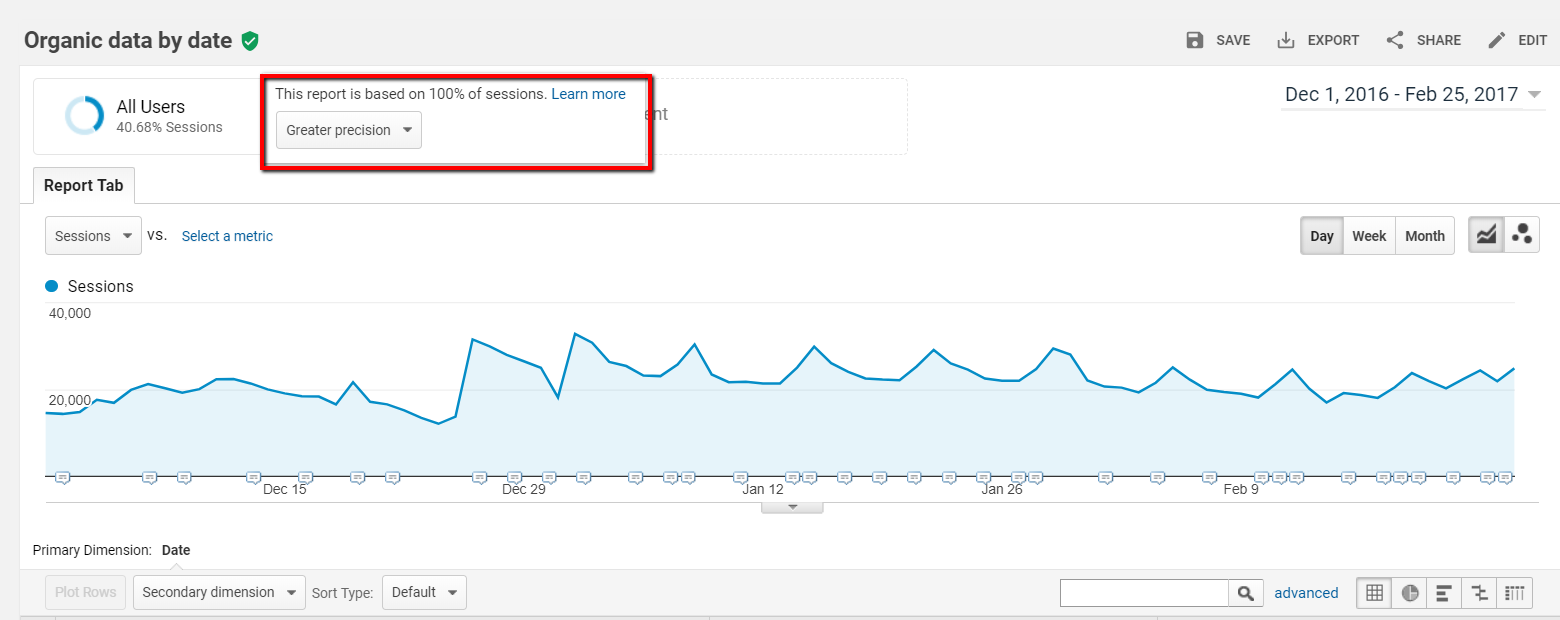
In Google Analytics you can see this by hovering over the shield up here.

If you've got heavily sampled data (let's arbitrarily say less than 80% of actual traffic), then in Google Analytics you've got a couple options (roughly ordered by ease of solution):
-
Look at a preset report
- Preset reports aren't sampled.
-
Eyeball check to see if the same issue exists in search console (for the relevant properties)
- Search console isn't typically affected as badly by sampling (for most websites, there are exceptions, which is the subject of another post).
- Shorten the date period
- Download an un-sampled report (Premium customers only :( )
- Draw down the data day by day with the API
Does the problem still exist when the data isn't sampled? Onto the next step.
2. Across which channels did it happen?
If you are already looking at just organic traffic skip this step. Otherwise first we need to double check that it is in fact our organic traffic which has dropped.
In Google Analytics (or analytics platform of your choice), open up the channels report:
Acquisitions > Channels) > [Plot rows]
Select your primary channels and plot them on the graph. Click through to organic as well, to see it by itself.
If you can't immediately tell which has dropped, set the date so you're comparing period on period.
Aside: Choosing a period
When picking a two periods to compare traffic, two useful tips:
- Make sure it contains the same number of weekdays and weekends or you might find our your traffic drop is just a weekend for example. This is easily done by picking a multiple of 7.
- If your first period begins on a Saturday, make sure your second period begins on a Saturday. It'll mean your traffic patterns should line up.

And we're back
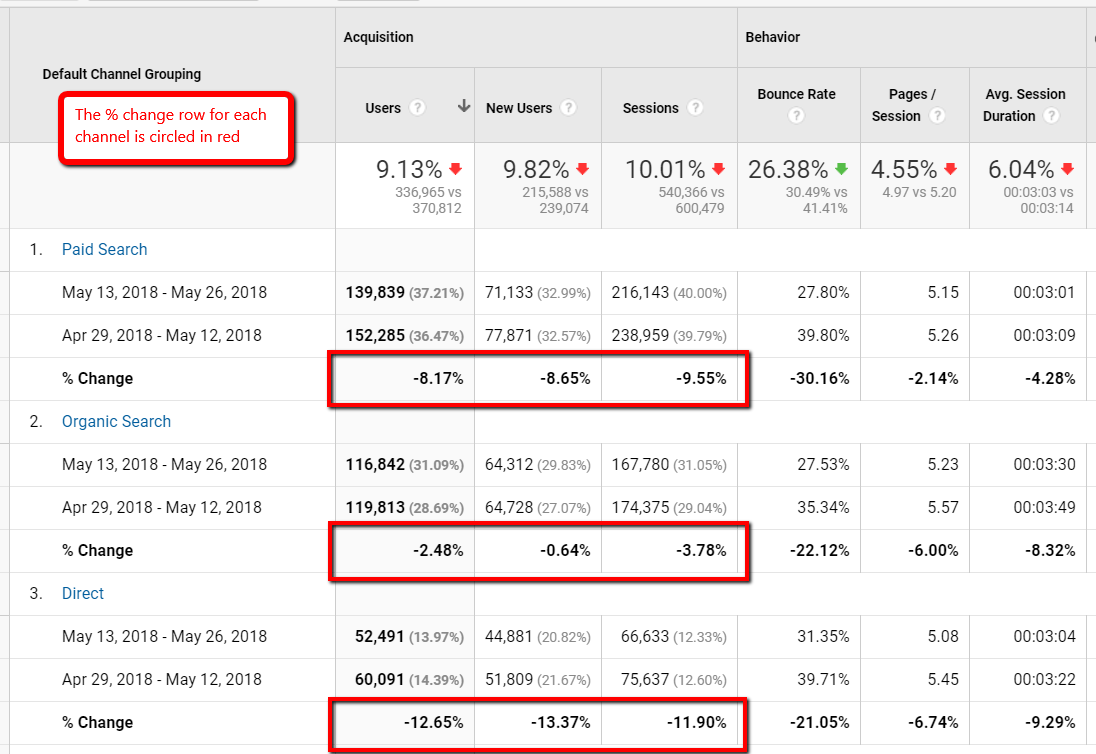
Once you've got period on period, you can quickly take a look and see the overall % change channel by channel.

Is the drop in organic traffic? Let's assume it is, so we can carry on with this post...
3a. Did you block part of the site with robots.txt?
Now we very quickly check three things, which if they have happened need urgent attention. They're also very quick to check.
First did someone block part of the site with robots.txt?
Head to the robots.txt testing tool in search console, click the Latest Version... drop down and see if Google has seen any different versions recently.
Then grab a sample of important pages e.g.:
- Homepage
- Category page
- Product page
- Blog post
Then use the tester to quickly check that no-one has blocked any of them.
3b. Did we accidentally no-index part of the site?
Again not that likely, but it's quick to check needs immediate attention if it has happened.
Use that sample of important pages you had above and check they're all indexable.
I wrote a Chrome extension to help me see this information more easily, but any tool of your choice will work.
3c. Did you get any penalties?
Another super quick check, that's hopefully unlikely, but quick enough that we check first.
Open up search console and see if there are messages about penalties (and by penalty I mean I specific manual action for which you'd receive a message).
Nothing serious here? They've not picked up on your PBN? Phew ok. Next step.
4. Could this be analytics issue?
For organic traffic drops we get two sources of data! Our analytics platform and search console.
This is fantastic as it gives us a sanity check in case we've botched our analytics.
There is one large caveat with search console and that's it is often split across multiple properties. For example: You won't see traffic for m.example.com in the search console profile for www.example.com.
If this is an issue for you, you'll need to combine search console data in Excel before moving on.
Once you've done that, you can compare the two:
What are our options?
- Both GSC and analytics are down - It's not an analytics mistake. Onto the next step.
- Analytics is down, but search console isn't - There's a good chance something has happened with our analytics. Time to look for changes.
-
Search console is down, but analytics isn't.
- Typically this means you've forgotten a search console property.
-
It could also be because Google search console shows you the URL that ranks as the page receiving traffic. Analytics programs will show you the actual URL that the visitor ends up on.
- For example: if a page with a redirect ranks, search console will show the traffic going to the URL, where as your analytics program will show the URL of the final redirect.
5. Is this just a normal fluctuation?
Still nothing obvious? Time for some deeper analysis. This is a big important step that I see a lot of people miss out on. We need to understand if our "traffic drop" is just an normal traffic fluctuation, that someone is complaining to us about. In my experience this is surprisingly common.
Our traffic change could be:
- Normal up and down movement fluctuation. Very few websites have ultra consistent traffic
- A seasonal fluctuation, we might always get less traffic at this point of year.
But we really need some sort of mathematical process to know how we should expect our traffic to look.
If we're down year on year, but this part of the year always has less traffic how do we quantify if we've lost more than a normal amount?
Two options:
- If you have a years data, then we can use the previous years data to help understand how this year should look.
- If you don't have a years data then we'll have to skip this step :(
So assuming you have got the data:
Step 1: Gather the data day by day
You want data which looks like this:
_
| ga:date | ga:sessions |
|---|---|
| 2018-05-19 | 237099 |
| 2018-05-20 | 316490 |
| ... | ... |
If you prefer the interface then there is template report here.
If you prefer the Google sheets API plugin, there then in the traffic drop spreadsheet there is a pre-configured API report that you can run and use to get it.
Step 2: Run a forecast to see if the change is notable
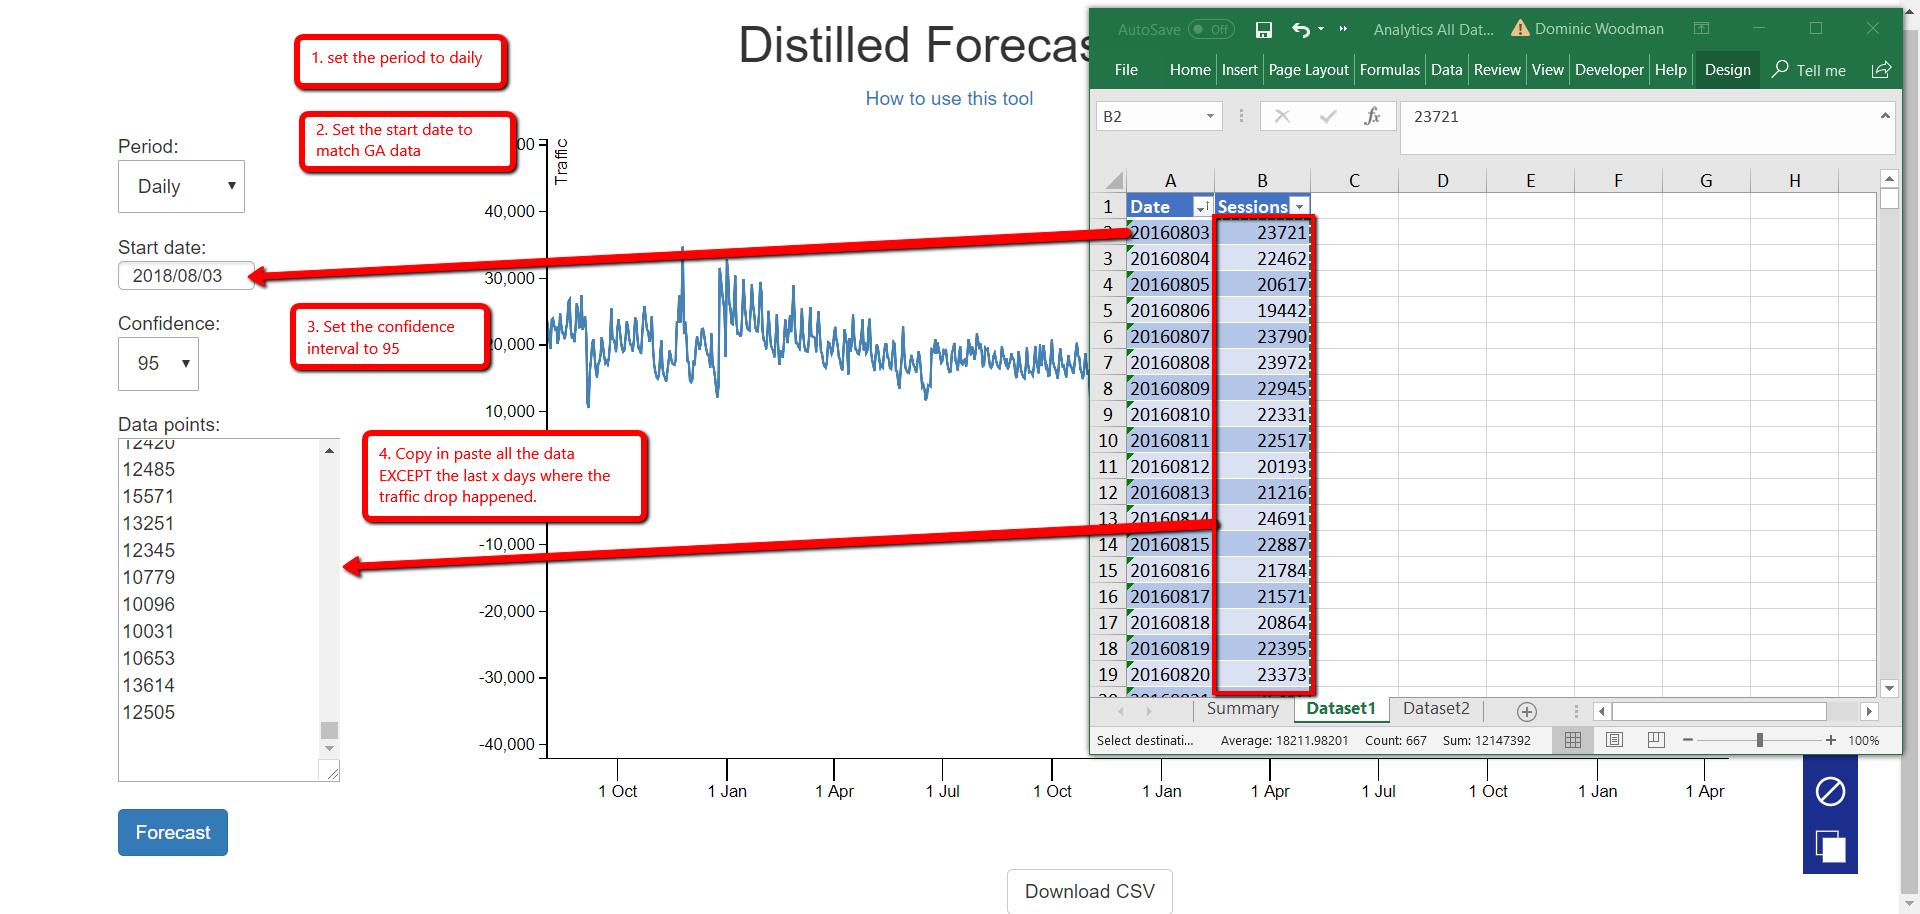
We're going to use a tool on the Distilled website, to see if the drop is significant.
While useful the tool has a couple quirks, which you need to know about.
This will be easiest through the medium of pictures.

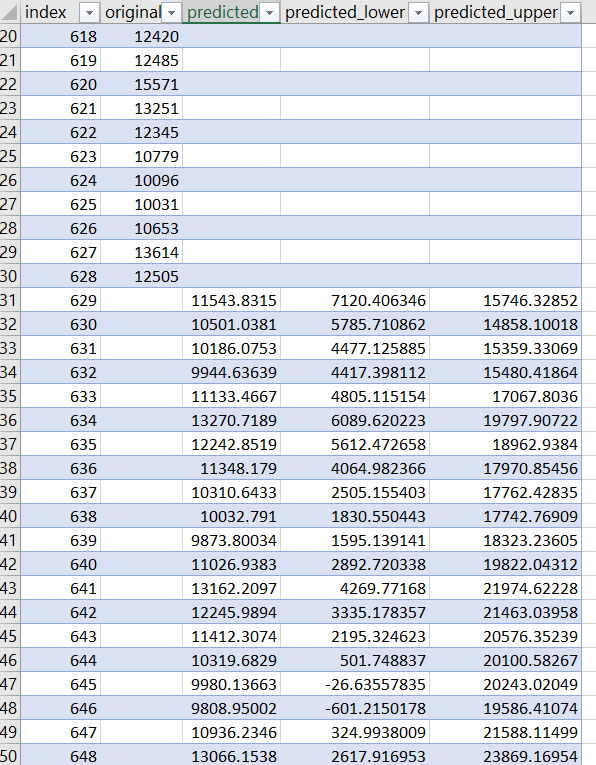
Then hit forecast, the tool spit you back out a forecast that is probably too long, so we're going to download it into excel. It should look like this (I've scrolled down a bit).

Remember in the instructions above, we left out the data where the traffic drop happened? We're now going to paste that back in and plot it in excel.

If the fluctuation is inside the grey lines then it's all good. Hoorah!
But if the traffic drop moves outside of the grey lines in this case we need to investigate further.
We might also end up investigating further, because people often want more information in this situation and while this technique is infinitely better than eye-balling it's still not 100% accurate.
If it is significant then on we go.
6. Is there a lot of chatter about a Google update?
We're definitely not being superstitious. We've had a traffic drop. Before we look into exactly where, time to take a quick look for industry chatter of a Google update.
Both Search Engine Roundtable and Search Engine Land are good places to catch this chatter relatively early.
You'll also almost certainly see it in the Twitter-sphere, if you've successfully disconnected from that, A. congratulations and B. Sparktoro's new project: Trending, will be I suspect be a good place to see the chatter summarized.
Finally there are numerous industry trackers which measure SERP flux as a proxy for an update:
While we can't immediately jump to conclusions, store this knowledge away to refer back to as we move down the list.
7. Where did the change happen?
Next up is work out exactly where the drop happened. I personally find the most useful way to do this is download a table from Google Analytics in the following format:
-
| Path | Page Path 1 | Page path 2 | Sessions |
|---|---|---|---|
| /folder/url1 | folder | url1 | 200 |
| /folder2/url2 | folder2 | url2 | 180 |
| /folder2/url3 | folder2 | url3 | 230 |
Do it for the before and the after period, then use vlookup to pull both sessions into the same table, so you end up with a table that looks like the following:
-
| Path | Page Path 1 | Page path 2 | Sessions - Period 1 | Sessions - Period 2 | Diff |
|---|---|---|---|---|---|
| /folder/url1 | folder | url1 | 200 | 180 | -20 |
| /folder2/url2 | folder2 | url2 | 180 | 160 | -20 |
| /folder2/url3 | folder2 | url3 | 230 | 240 | 10 |
At which point you can throw it into an Excel pivot table, or just eye-ball it to see where the changes are happening.
Once you've answered the question, there are two main outcomes.
The drop was sitewide
Unless you've migrated, or re-designed the entire site (unlikely considered you've reached this post), then if you're seeing this kind of traffic drop it's more likely to be a Google update, keep a close eye on the industry chatter for the next couple days and see what goes around.
If it does turn out that your site has been hit by a Google update prepare to receive the standard advice that gets dolled out to sites that are hit by Google updates:
- Follow the quality rater guidelines
- Stop all that aggressive advertising you've been doing
- Improve usability
- Users first
- Don't be an affiliate
- Audit your links
- Etc. etc.
I.e. Keep on doing your job, just do it faster and better. I'd love to say you might hire someone who will swoop in and spot that one thing which will fix you up, but my experience has been that's just not case.
You're in for a long hard slog. Fingers crossed it might cause more senior people to wake up and invest into SEO properly.
You might still want to follow the next step and check your rankings just in case you missed anything.
The drop was on a specific section
It could be a couple things at this point, depending on the speed of the drop-off. Likely candidates are:
Changes that can happen over any time period, short or long:
- A product change made to part of your site.
- Google rolling out new SERP features.
- News story for crucial terms for your brand pushing you down.
- A Google update
Changes that more likely to happen over a week or two:
- A competitor getting swapped above you for crucial pages
- A non-seasonal event (i.e. one the forecast couldn't predict), like a new tax on a product you sell.
To help us un-pick which has happened we need to go and get some more data.
8. Getting more data
Ranking data
To start ruling out some of the options above, we're going to need some more data and the most helpful kind will be ranking data.
You can use any rank provider of your choice (I personally like STAT), but you're going to want the following features:
- Daily rank tracking
- Rich snippet tracking
- SERP archiving
- Tracking of the entire SERP rather than just your website position.
If you don't have any rank tracking set-up for your website, then you'll need to use someone who provides historical rank tracking like:
With that data we can then begin to rule out (or validate), some of the options above. With SERP archives we should immediately be able to answer some of those questions:
- Did new rich snippets appear?
- Did any news articles appear?
- Did our competitors leap frog us?
Industry data
If there are no changes there, then we can go and look at industry data. Depending on the size of your company you might already know this. But if you don't time to go find out if there were any notable events that happened which might've affected you.
Product updates & Google updates.
Finally time to head to head to your product team and find out what changes got released on your website.
If you've reached here it's often a judgement call between did we make a change that caused the traffic drop or was it a Google update.
Obviously I can't answer this one for you, in my experience however unless you're doing something like fiddling with title tags or a big change, a Google update is actually more likely.
My experience with SEO split testing and running all the clients on DistilledODN for a year has been that actually most changes don't have an effect and as an industry we worry far too much about a lot of little things.
Of course getting hit by a Google update is representative of your entire website, I'm just saying it's more likely to be the aggregate of the decisions you've made, rather than the small header change you made in the last week.
9. Conclusion
Hopefully by this point you've figured out what happened, and off the back of that can make a plan of action to combat it.
Let me know if I've missed anything obvious, or have any other neat checks you'd recommend doing.
Doubly so if this checklist hasn't helped you solve your problem!